What is ABC analysis for inventory?
ABC analysis is simply a method to manage your inventory by categorizing it. Think of it as a ranking system for the different products in your inventory. The fast-moving, high-demand, and high-cost goods have a high priority. While the slow-moving, low-demand, and low-cost items have a relatively lower priority.
Such ranking or prioritization is critical since it determines the actual worth of each product. That is, it outlines the share of total revenue a product accounts for. Gaining this knowledge empowers you to optimize your inventory accordingly for faster and more efficient operations. What percentage a product contributes to your total revenue is determined by its inventory velocity, unit price, and order volume.
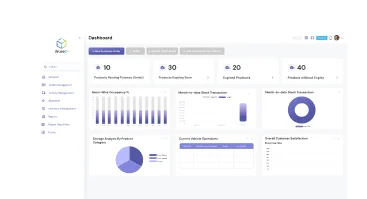
In ABC analysis, inventory managers consider key factors like a product’s risk, cost, and demand, besides the factors shown above. Using this information, they can assign products to different categories based on priority. Modern warehouse management software like WareGo has built-in support to easily implement this proven method.
The modern inventory software has all the tools you need to simplify inventory.
Start FREE Trial!Table of Contents
ABC Inventory Analysis – What ABC means
Business leaders rely on ABC inventory analysis to understand how critical each product is to their organization’s financial performance. Some will obviously be more critical than others, while others will be less so. Here is a breakdown of how the inventory is broken down during the analysis:
- Class A goods are those that are the most critical for your total revenue. These are often fast-moving, high-demand items as mentioned above.
- Class B goods are somewhere in between. They are not as important as Class A goods, but they are certainly more valuable than Class C goods.
- Class C goods are often the least critical. As you would expect, they are slow-moving, low-demand items that you previously came across.
So now you know where the “ABC” comes from in ABC analysis. These are simply product categories based on importance, with Class A being the most important and Class C being the least important. At this point, it must be noted that complex inventories may need further categories beyond the 3 we discussed so far. So don’t be surprised if you see categories A, B, C, D, E, and F.
Another interesting fact worth pointing out from the get-go is the ubiquitous 80/20 rule. This rule holds true for inventory as it does for so many other things. Hence, about 20 percent of your inventory will account for 80 percent of your revenue. As you would expect, this distinction holds true for Class A goods.
Cost accountants use something similar to ABC analysis to assign costs that can’t be directly attributed to a unit product, such as fixed costs and overheads (think rent and utilities).
The Pareto Principle
The 80/20 rule mentioned above is basically the Pareto Principle. It is the foundation for ABC analysis. This common observation has startling implications that you can’t ignore if you want to optimize inventory management.
Basically, 20 percent of the input is responsible for 80 percent of the output, give or take.
This observation can be seen in the world around us.
For example, around 20% of the software bugs may be responsible for 80% of the Windows system crashes, a fact noted by Microsoft.
Reddit users can be found marveling at how 20% of their plants produce around 80% of the fruit.
The list goes on. The Pareto Principle can be found in the most unexpected places. The Pareto rule can be seen in other places in business besides just inventory.
For example, 20 percent of customers contribute towards 80 percent of your revenue.
While 20 percent of problems are responsible for 80 percent of customer complaints.
While the exact percentages may not precisely be 20% or 80%, real-life percentages do seem to be somewhat close, if not identical to the 80/20 rule.
Clearly, since around 20 percent of your inventory brings the bulk of your profits, it would be most fruitful to prioritize this inventory category for efficient operations.
Calculating ABC Analysis In Inventory Management
To carry out ABC analysis in inventory management, multiply the annual demand for a product by its price. This gives you the annual revenue for a specific product. You can do the same for all products and then group them to create Class A, B, and C categories. The bulk of your resources will then go towards managing Class A goods.
Here is the formula you will be using to understand the value of each product. Note that this formula is for a specific product or SKU. So you will have to do the same for all products and SKUs that you have. To simplify the process, you can use Excel or some other spreadsheet.
(Number of items sold each year) x (Unit price) = (Annual sales revenue from a product)
With a spreadsheet, you can arrange the aforementioned list of products in descending order according to the annual sales revenue for each product.
ABC Analysis In Action – How It Helps
So with ABC analysis complete, what comes next? There is a lot that a business can do once ABC analysis is done. You can optimize your inventory arrangement with the help of ABC Analysis.
How ABC Analysis Optimizes Inventory
Using ABC Analysis; Class A goods can be placed closer to the workers, whereas Class C goods can be kept deeper inside the warehouse. This way the frequently requested goods are much closer to the workers in the warehouse.
What is the benefit of this arrangement?
The average worker’s travel distance will decrease. Productivity and picking rate will increase as a result. Since Class A goods have the highest demand, it makes sense to place them closer to workers so they travel less overall. Placing Class C goods deeper inside the warehouse is not a bad idea since these items have a low demand anyway.
Your workers will now pick up more items per hour. Operations speed and fulfillment rate will rise thanks to smart inventory placement informed by ABC analysis.
Other Uses for the ABC Classification System
Working capital costs can be controlled more effectively with ABC classification system.
For example, by understanding the relative contribution of each product, you can now identify dead-stock and low-demand items with little profitability. You can cut costs and improve profit margins by removing such problematic items.
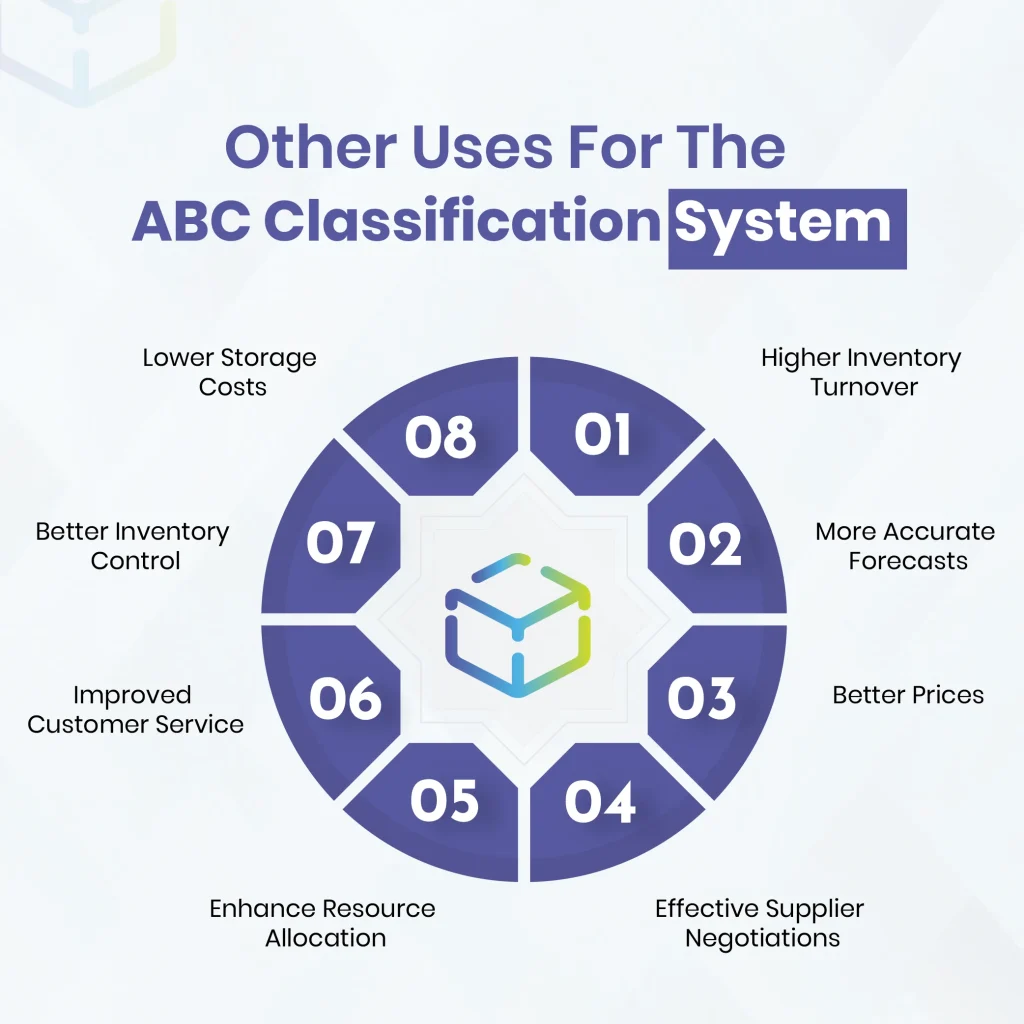
Here are some benefits of using ABC analysis.
- Higher Inventory Turnover: By identifying and removing low-demand and slow-moving items, you can greatly increase the turnover rate, cut costs, and boost profit margins.
- More Accurate Forecasts: ABC analysis at regular intervals can tell you which items have a predictably high demand and which don’t. You can phase out less predictable items that contribute less to your revenue. With this information and consistently performing inventory, you can make better forecasts.
- Better Prices: You can check which items are undergoing a surge in demand, and then consider increasing prices accordingly.
- Effective Supplier Negotiations: Since your Class A goods are just 20 percent of your inventory, some suppliers, often a handful, are far more important than others. Hence, it makes sense to negotiate better rates and terms with these key suppliers. In case you don’t get lower prices, you can discuss bulk discounts, free shipping, post-purchase services, and so on.
- Enhance Resource Allocation: Carrying out regular ABC analysis is important since some products can move from Class A to Class C and vice versa. This can happen due to changing preferences, seasons, and so on. Reclassifying products means you can then assign more resources to the products that really matter.
- Improved Customer Service: As explained, ABC analysis increases the order fulfillment rate via improved worker productivity. Faster order fulfillment improves overall customer satisfaction. You can also allocate your limit support staff and resources towards more profitable products.
- Better Inventory Control: Closer monitoring in real-time is required for Class A items since these are the most valuable. Procurement and operations personnel can monitor these critical items more closely to prevent them from going out of stock.
- Lower Storage Costs: You can make more efficient use of your valuable warehouse space by steadily increasing the volume of Class A goods and phasing out dead stock and slow-moving items. Inventory holding costs will go down as you clear out dead stock.
Limitations with ABC Analysis
Despite its many benefits, ABC analysis does have limitations that can’t be ignored. Every business has unique challenges like evolving customer demand patterns that can strongly impact the effectiveness of ABC analysis if care is not taken.
A big problem is the dynamic nature of inventory. What may be in Class A today may shift towards Class C the next month. This can happen due to unexpected changes in demand, for instance. Given this issue, where products are continuously moving back and forth between different categories, carrying out ABC analysis on a regular basis is the need of the hour.
However, this is a time-consuming process, especially when you have complex inventory and many SKUs to deal with.
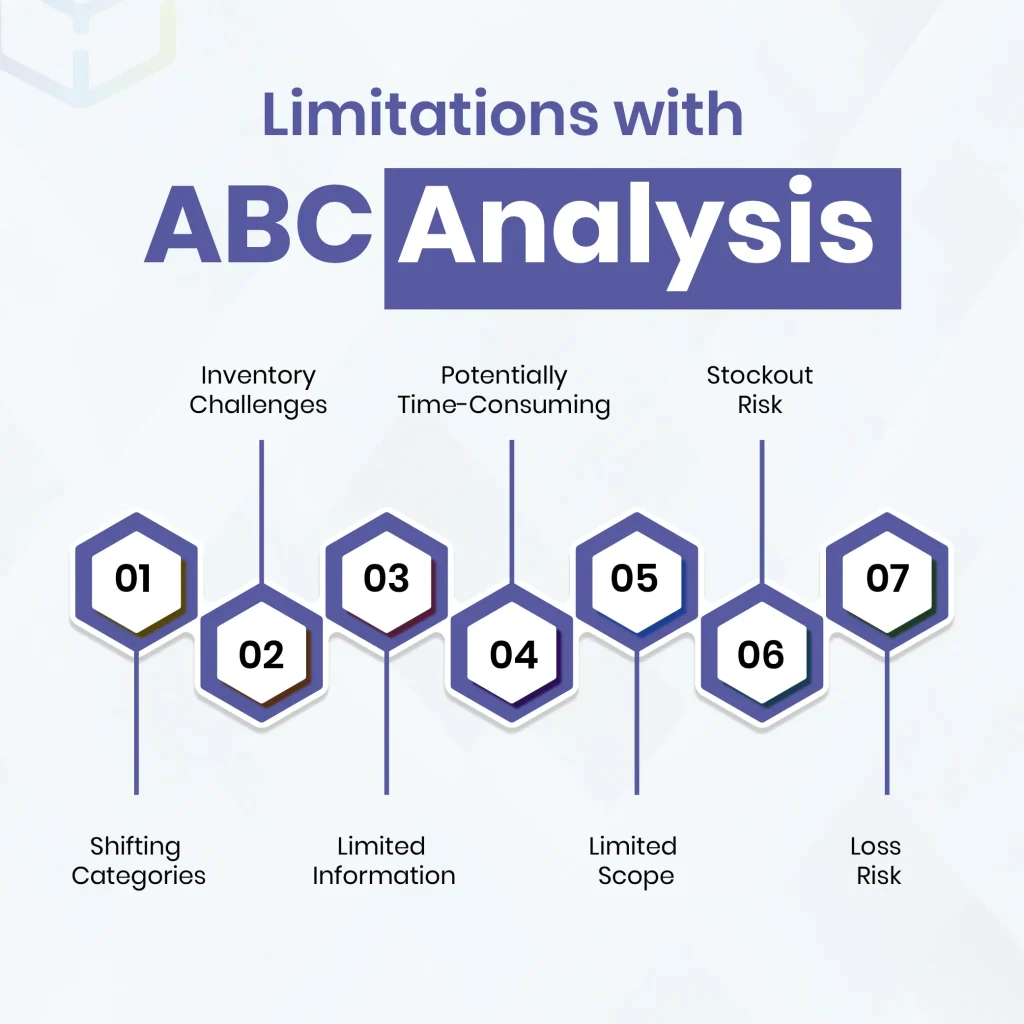
Here are the disadvantages in greater detail.
- Shifting Categories: As explained, products may shift from one class to another. The problem here is that the business may not realize that products have shifted between classes until it is too late. Costs can rise, and customer satisfaction can take a hit.
- Inventory Challenges: Many inventory items face problems like seasonal demand, obsolescence, and other issues, leading to highly variable product demand. In which case, ABC classification benefits will be greatly limited. Likewise, new items pose a serious challenge since they have no previous demand pattern. Hence, ABC analysis fails for brand-new items.
- Limited Information: ABC analysis does not consider many other factors that can strongly affect the demand pattern for your products. While regular ABC analysis is useful for forecasting, it is time-consuming and may not cover everything.
- Potentially Time-Consuming: Variable product demand means that products can shift categories quite quickly. For example, a class A product might become a class C product due to seasonal change. Hence, unless reviewed regularly, ABC analysis may actually be misleading and can create inefficiencies instead of removing them. But regular ABC analysis reviews can consume time. It can be an added burden for staff who are already using other costing methods based on generally accepted accounting principles or GAAP. The problem worsens for companies that handle complex inventory or many SKUs.
- Limited Scope: ABC analysis values products only by order frequency and profit margin. However, products may provide value in different ways beyond just orders and profits. For example, a novel item may attract customers who then buy other products.
- Stockout Risk: Class C items may be given less importance since they are recognized as relatively low value. Hence, they may be given a lower priority for smart cycle counts where valuable items (Class A goods) are singled out for physical stock taking. Stockout risk can increase for Class C if care is not taken.
- Loss Risk: While Class C items have less value, it does not mean they can be ignored. Giving very low priority to Class C items can possibly lead to problems like increased theft.
ABC Analysis – How Its Done
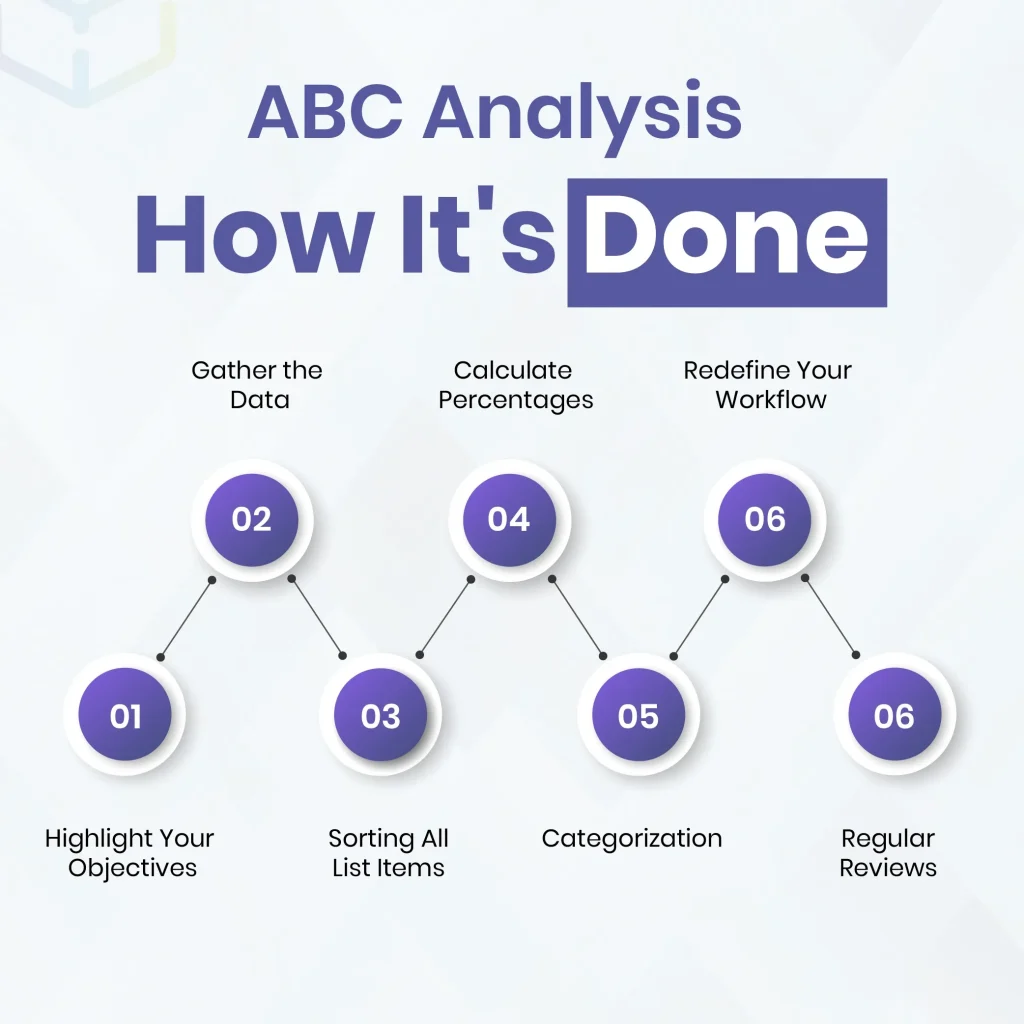
ABC analysis can be done using a spreadsheet if you don’t have inventory software.
Here is a simple outline for how ABC analysis is carried out:
- Highlight Your Objectives: You must first understand what you intend to achieve via ABC analysis. It could be a higher fulfillment rate, reducing worker travel distance, lowering inventory costs, or improving cash flow. Once you determine these objectives, you can track their KPIs and values to find out how ABC analysis improves them.
- Gather the Data: For ABC analysis, you basically have to find the annual sales contribution for each product in your inventory. Doing so is fairly easy. You just have to multiply the selling price by the annual product demand. Once you do this, you can also calculate the total gross profit margin for each product simply by deducting the product cost from the sales price. However, assigning indirect costs and overheads (depreciation, rent, utilities, and marketing costs) can be rather complex.
- Sorting All List Items: Arrange all entries on your spreadsheet in descending order with just a click. Doing so is easy, whether you are using Excel, Google Sheets, or Libre Office. You will now have your items arranged in terms of sales impact, with the most impactful items on top.
- Calculate Percentages: For each product in your list, calculate the relative importance of each item. Doing so is simple. Simply divide the annual cost of each product by the total annual cost of ALL products and multiply the fraction by 100.
Product Percentage Weight = (Annual Cost for the Product) / ( Annual Cost for ALL Products) x 100
- Categorization: This is where you get to see the 80/20 rule in action. You will notice that around 20 percent of your items are responsible for around 80 percent of your total sales. Since your ordered list is in descending order, you can select the percentage weights (as defined above) for the top 20 percent of your products.
This will, of course, be the Class A category. Expect slight deviations from these percentages.
Class B products are those that have a medium value. These will be around 30 percent of your items, accounting for around 15 to 20 percent of your total sales.
Class C products will have the least value. These are the bottom 50 percent of your products, accounting for around 10 percent of your total sales.
If your inventory is more complex or you have many inventory categories, you may need extra categories for a more reasonable prioritization.
Feel free to add D, E, F, and so on as you deem fit. Your business can have a different need beyond the A, B, and C categories normally used due to your unique niche and requirements.
- Redefine Your Workflow: You should now streamline your supply chain and inventory processes based on this new data. For example, Class A goods should be placed close to workers in your warehouse, next to the main walkways. Class C goods can be placed deeper inside. Overall worker travel distance will reduce with this arrangement.
Consolidate suppliers for Class A goods. Prioritize coordination with them since they are your most valuable suppliers. Try to seek better rates, bulk discounts, free shipping, or other such benefits from them since these will positively impact the bottom line. If possible, you can consider switching over to suppliers who offer better terms and benefits.
Assign more customer support for Class A goods since this is where the money is.
Class A goods will need closer monitoring to prevent stockouts. They will also need more smart cycle counts for inventory accuracy and fewer stockouts.
- Regular Reviews: Products can switch categories quite fast. Hence, regular reviews are necessary to quickly identify any changes to the product categories.
Besides, you should check up on key metrics to assess how helpful ABC analysis is proving for your defined objectives.
Best Practices for ABC Analysis
You will naturally have to give greater attention and assign more resources for handling Class A goods since this constitutes the bulk of your profits.
One of these best practices would be using a powerful inventory management system to automate ABC analysis.
Here are some best practices to apply to get the most out of ABC analysis.
- Easy Classification: You may know that the main classes are A, B, and C. However, you can categorize your products into these classes based on different metrics. The most commonly used metric is the annual consumption value, which gives the total cost of the product in one year. To find it, you can use the simple formula:
Annual consumption value (for a product) = Total Annual Demand x Unit Cost
There are other metrics you can use to categorize inventory into A, B, and C classes, for example, by order frequency, profit margin, purchase cost, holding costs, and so on.
You can use one or more of these metrics to achieve different operational objectives. For example, categorizing by profit margin will boost profitability, while categorizing by holding costs can help reduce inventory costs.
- Logically Assign Resources for Inventory: Class A goods should be assigned the most resources, while Class C goods may be assigned the least. For example, managers can assign 8 hours towards reviewing Class A goods and 2 hours for reviewing Class C goods. Likewise, for smart cycle counts, they can assign 12 hours towards Class A goods for 3 hours assigned for Class C goods.
- Review Extra Inventory: Take a look at your current inventory levels and consider if they make sense for your situation. For just-in-time and lean inventory, you will want minimal inventory levels to minimize inventory holding costs and drive profitability. If you need to hold inventory above this level, make sure to categorize it correctly using ABC analysis.
- Manage All Locations: Having full visibility over inventory across all locations is important for reliable ABC analysis. Good inventory software is needed for this.
- Regular Performance Reviews: To find out the effect that ABC analysis is having on operations, regular reviews are necessary. By carrying out ABC analysis using different metrics (like holding costs, profit margins, and order frequency), you can understand how well it supports your key operational goals.
- Inventory In Transit: Keep track of supplier lead times. Find out how long it takes for inventory to reach your warehouse once you place the order.
- Reclassify When Needed: Inventory can change from high value to lower value and therefore jump from Class A to Class B. This can happen due to different factors, like changing customer preferences, different market conditions, and so on. Carry out ABC analysis at regular intervals to detect changes in the value of your products.
- Software Automation: While spreadsheets are easy to use, they are in no way a replacement for robust inventory software. While you can use the method outlined above to categorize all products in order of importance, bear in mind that it is a manual process that will cost you time and effort. But with specialized inventory software, you don’t need to carry out this process manually since the system does it for you.
Smart automation features from our inventory software can skyrocket your productivity.
Let’s Talk!ABC Analysis for Different Industries
Any business that deals with inventory can benefit strongly from ABC analysis. Here is how different industries stand to benefit.
- Retail: ABC analysis identifies the most profitable products for retail businesses. Closely monitoring these products can prevent stockouts.
- Automotive: Indicates the most critical components and parts that need careful tracking. Reaching out to these suppliers and negotiating with them can mean better terms and contracts.
- Warehousing: Controlling warehouse inventory becomes easier and more effective when you can identify inventory items with the highest holding costs, order frequency, and profit margins.
- Manufacturing: ABC analysis can categorize raw materials, components, parts, and finished products in terms of profit margins, costs, and other useful metrics. Resources can then be assigned accordingly.
Bottom Line
ABC analysis is a powerful tool for inventory control that can prevent stockouts, overstocking, and other common inventory problems. It streamlines and simplifies inventory management by categorizing inventory items into separate categories based on the value they provide.
To take advantage of this proven inventory control tool, you can rely on an inventory control software that has built-in support for ABC analysis.
The next-gen inventory software has the full range of tools for simplified inventory management.
Book FREE Demo!FAQs
What is ABC Analysis in Inventory Management and how does it support inventory optimization?
ABC analysis in inventory management is a proven method for inventory control. It supports inventory optimization by categorizing your inventory according to value so you can direct limited resources towards the most valuable items.
Is ABC inventory control still relevant when companies already use ERP or SAP?
Yes. ABC inventory control is still relevant when using ERP or SAP because they have built-in support for this inventory best practice.
How can ABC analysis help manage long-tail inventory in industrial companies?
Yes, ABC analysis can help manage long-tail inventory in industrial companies by categorizing high-value and low-value inventory so you can direct your limited resources accordingly.
How does AI improve the accuracy of ABC inventory classification?
AI can improve the accuracy of ABC inventory classification by continuously monitoring each product for category shifts. That is, inventory products are known to shift between categories. Hence, AI can detect these shifts in real-time to update your inventory analysis so it stays relevant.
What business benefits does ABC Analysis deliver for inventory control and supply chain management?
ABC analysis delivers various business benefits for inventory control and supply chain management in the form of reduced holding costs, fewer stockouts, less overstocking, and better cash flow.